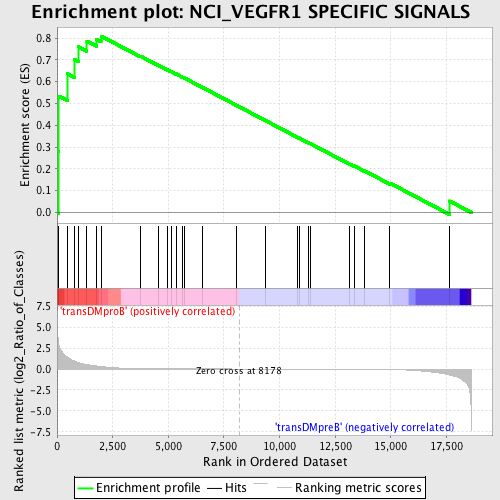
Profile of the Running ES Score & Positions of GeneSet Members on the Rank Ordered List
| Dataset | Set_04_transDMproB_versus_transDMpreB.phenotype_transDMproB_versus_transDMpreB.cls #transDMproB_versus_transDMpreB.phenotype_transDMproB_versus_transDMpreB.cls #transDMproB_versus_transDMpreB_repos |
| Phenotype | phenotype_transDMproB_versus_transDMpreB.cls#transDMproB_versus_transDMpreB_repos |
| Upregulated in class | transDMproB |
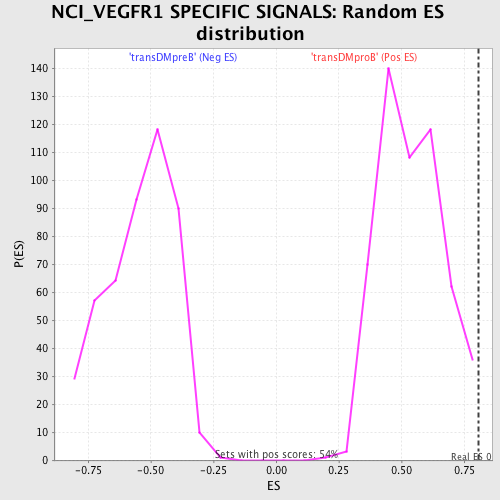
| GeneSet | NCI_VEGFR1 SPECIFIC SIGNALS |
| Enrichment Score (ES) | 0.8090652 |
| Normalized Enrichment Score (NES) | 1.497858 |
| Nominal p-value | 0.007434944 |
| FDR q-value | 0.31430644 |
| FWER p-Value | 0.975 |
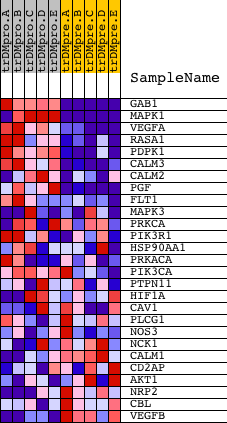
| PROBE | DESCRIPTION (from dataset) | GENE SYMBOL | GENE_TITLE | RANK IN GENE LIST | RANK METRIC SCORE | RUNNING ES | CORE ENRICHMENT | |
|---|---|---|---|---|---|---|---|---|
| 1 | GAB1 | 18828 | 58 | 3.226 | 0.2797 | Yes | ||
| 2 | MAPK1 | 1642 11167 | 80 | 2.911 | 0.5339 | Yes | ||
| 3 | VEGFA | 22969 | 468 | 1.407 | 0.6365 | Yes | ||
| 4 | RASA1 | 10174 | 782 | 0.936 | 0.7017 | Yes | ||
| 5 | PDPK1 | 23097 | 950 | 0.777 | 0.7609 | Yes | ||
| 6 | CALM3 | 8682 | 1340 | 0.528 | 0.7863 | Yes | ||
| 7 | CALM2 | 8681 | 1771 | 0.355 | 0.7943 | Yes | ||
| 8 | PGF | 21020 | 1976 | 0.293 | 0.8091 | Yes | ||
| 9 | FLT1 | 3483 16287 | 3749 | 0.038 | 0.7171 | No | ||
| 10 | MAPK3 | 6458 11170 | 4552 | 0.016 | 0.6754 | No | ||
| 11 | PRKCA | 20174 | 4949 | 0.012 | 0.6551 | No | ||
| 12 | PIK3R1 | 3170 | 5127 | 0.011 | 0.6465 | No | ||
| 13 | HSP90AA1 | 4883 4882 9131 | 5345 | 0.009 | 0.6357 | No | ||
| 14 | PRKACA | 18549 3844 | 5640 | 0.008 | 0.6206 | No | ||
| 15 | PIK3CA | 9562 | 5742 | 0.007 | 0.6158 | No | ||
| 16 | PTPN11 | 5326 16391 9660 | 6520 | 0.004 | 0.5744 | No | ||
| 17 | HIF1A | 4850 | 8052 | 0.000 | 0.4920 | No | ||
| 18 | CAV1 | 8698 | 9359 | -0.003 | 0.4220 | No | ||
| 19 | PLCG1 | 14753 | 10822 | -0.007 | 0.3440 | No | ||
| 20 | NOS3 | 16906 885 | 10874 | -0.007 | 0.3418 | No | ||
| 21 | NCK1 | 9447 5152 | 11280 | -0.008 | 0.3207 | No | ||
| 22 | CALM1 | 21184 | 11378 | -0.008 | 0.3163 | No | ||
| 23 | CD2AP | 22975 | 13164 | -0.019 | 0.2219 | No | ||
| 24 | AKT1 | 8568 | 13355 | -0.021 | 0.2135 | No | ||
| 25 | NRP2 | 5194 9486 5195 | 13821 | -0.027 | 0.1909 | No | ||
| 26 | CBL | 19154 | 14950 | -0.058 | 0.1353 | No | ||
| 27 | VEGFB | 23800 | 17635 | -0.706 | 0.0528 | No |